How 211 is Helping Pennsylvanians
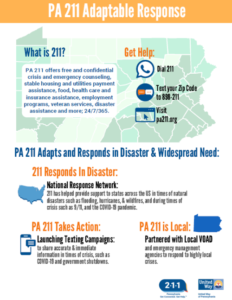
211 is a vital service leveraged by millions of people across North America. Every day, clients contact 211 to access free and confidential crisis and emergency counseling, disaster assistance, food, health care and insurance assistance, stable housing and utilities payment assistance, employment services, veteran services, and childcare and family services.
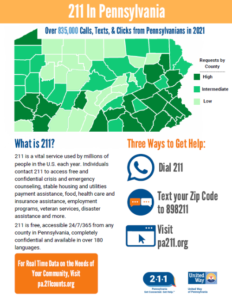
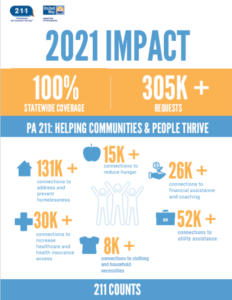
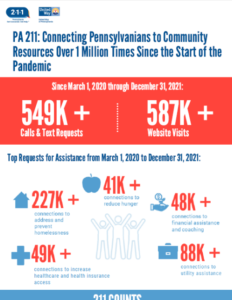
No matter the situation, the specialists at 211 listen, identify underlying problems, and connect people in need with resources and services in their community designed to improve their lives. In 2021 alone, PA 211 answered more than 300,000 calls, texts, and chats in Pennsylvania, and people connected to resources on the web over 530,000 times.
PA 211 connected Pennsylvanians to help over 1 million times since the start of the pandemic. For a summary of PA 211’s response to the COVID-19 crisis from March, 2020 through December, 2021, have a look at our COVID-19 response 2021 data summary. To look back at community needs and our response to the COVID-19 crisis in 2020, check out our 2020 interactive data page.
211 Counts
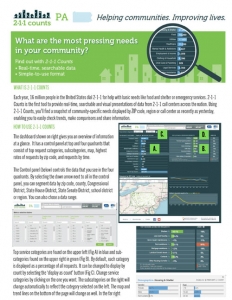
Each year, millions of people in the United States dial 211 for help with basic needs like food and shelter, or emergency services. 211 Counts is the first tool to provide real-time, searchable and visual presentations of data from 211 call centers across the nation. Using 211 Counts, you’ll find a snapshot of community-specific needs displayed by ZIP code, region or call center as recently as yesterday, enabling you to easily check trends, make comparisons and share information. 211 Counts works with PA 211 to share this information with community leaders and service agencies. Visit pa.211counts.org.
How is the data collected?
Across the U.S., 211 call centers handle millions of calls every year. Call centers provide aggregated data about the calls to 211 Counts, which systematically tracks and summarizes callers’ needs.
What does “Total Calls” mean?
“Total Calls” and “Total Service Requests,” displayed across the top of the page, reflects all calls and service requests to the call center during the selected time range and for the selected geographical area. One caller may request more than one service.
Does 211 Counts track all of those calls?
211 Counts offers data about the top requests — the most important basic needs of callers, such as food, shelter and clothing. 211 Counts displays most of the remaining requests in additional categories or in “Other”.
Can I get more specific data?
Yes. Clicking on a category enables the user to view categories , and their percentage or total count of calls within the category.
Can I display the data by location?
Yes. Data from each call center can be shown by ZIP Code, County, Congressional district, state House district, state Senate district and region. The location you select at the top of the dashboard will be displayed on the map below. Click on “all” to display all of those locations within one grouping (e.g., counties) on the map; hover over each location for the data.
How are the locations and their data determined?
U.S. Census maps are used for all locations except “region.” A region is a group of ZIP codes served by a call center; some call centers serve more than one region. Request data are collected for each Census ZIP code (which may differ from the U.S. Postal Service ZIP code). The data for each ZIP code are assigned to each of the locations on the dashboard. To avoid duplication, call data from each ZIP code is displayed in only one location in each grouping (e.g., a Congressional district) A ZIP code that spans more than one location area is assigned to the one that includes that ZIP code’s geographic center.
What do the colors on the map indicate?
The rate of a particular type of call is expressed per 1,000 adults living in that ZIP code, reflected on the map of data. Each ZIP code is colored to reflect a “high,” “intermediate” or “low” rate of calls compared to others in that region. When “all” regions are viewed on the map, the colors reflect the comparative call rates for all regions of a call center.
Is other community information displayed?
Yes. U.S. Census data on population, poverty, unemployment, rental housing and education can be viewed.
How far back does the data go?
It varies by call center. Data from some centers is available as early as 2013. Use the custom date field to display that data.
Are there ways to learn more about how to use 211 Counts?
There is a video tutorial available on YouTube.
I love your site! How can I share it?
Links to social media and other ways to share the date are displayed in a column on the left side of the dashboard.
Why is the category count different than the total of its subcategory count?
Coding procedures differ between call centers. Some centers may code a request broadly, such as “utilities,” while other centers may code a similar request more specifically, such as “electric”. “Electric” will fit within one of the 211 Counts subcategories while ‘utilities’ will not.
If you have more questions about 211 Counts, please contact us.
Interested In Promoting PA 211 in Your Community?
If you would like to share information about PA 211 with your network, please feel free to use this informational language for an email blast or newsletter article. You can also follow the links in this page’s footer to share PA 211’s social media content. For information on PA 211 regional contact centers, please view our map. To explain when to call 911, 988, or 211, please view this graphic. If you would like promotional materials like posters and wallet cards shipped to you for free, please fill out this short form.
Are You A Provider?
If you are an agency that would like to become part of PA 211’s database, or update your details, go to our Providers Page.
![]()
PA 211 is a member of the Alliance of Information and Referral Systems (AIRS)